Editor's Note: This article is part of a series on the supply chain effects of changes to the ocean freight industry. All stories in this series can be found here.
Shipping alliances consolidated from 4 to 3
Independent shipping lines' market power decreased as global carriers banded together into three, larger alliances.
2016 Alliances
2017 Alliances
SOURCE: Alphaliner TOP 100 data from February 2016, July 2017.
A string of deals shifted the makeup of each alliance
Today's three alliances contain a motley crew of former partners. The chart below displays who is in which alliance, and their allegiance in 2016.
Former alliances (2016) Key:
- 2M Alliance
- Ocean Three Alliance
- G6 Alliance
- CKYHE
- Other
- None
New alliances (2017)
-
2M + H Alliance
- Maersk Line
+ Acquired Hamburg Sud - MSC
- HMM
- Maersk Line
-
Ocean Alliance
- CMA CGM
+ Acquired APL, Mercosul - COSCO
+ Acquired China Shipping, OOCL - Evergreen
- CMA CGM
-
THE Alliance
- Yang Ming
- Hanjin
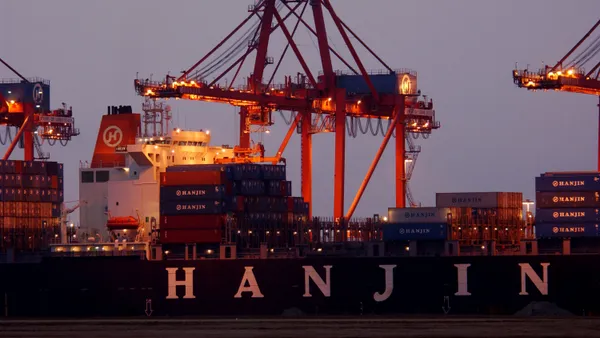
Hanjin Shipping declared bankruptcy August 2016. - Hapag-Lloyd
+ Acquired UASC - Ocean Network Express
+ Merger of NYK, K Line, MOL
SOURCE: Various news reports / continuing coverage.
Deals lead major shipping lines to boost capacity
Carriers invested heavily in more and larger vessels, at times growing their capacity at triple-digit rates.
% capacity change from 2016 to 2017, in TEU
s| Shipping Line | 2016 Capacity (TEUs) | M&As | 2017 Capacity (TEUs) | Change in Capacity by % |
|---|---|---|---|---|
| Ocean Network Express
Merger of NYK Line, MOL and K Line |
N/A | K Line2016 Capacity: 380,273, NYK Line2016 Capacity: 479,489, MOL2016 Capacity: 568,493 | 1,407,906 ▲ +204%** |
▲ +204%** |
| COSCO Shipping*
Acquired: China Shipping*, OOCL |
853,947 | China Shipping*2016 Capacity: 708,379, OOCL 2016 Capacity: 577,576 | 2,452,452 ▲ +187% |
▲ +187% |
| SM Line (heir to Hanjin's assets) | 620,770 | 48,315 ▼ -92% |
▼ -92% | |
| Hapag-Lloyd
Acquired: UASC |
931,760 | UASC 2016 Capacity: 549,124 | 1,520,477 ▲ +63% |
▲ +63% |
| CMA CGM
Acquired: APL |
1,812,166 | APL2016 Capacity: 528,968 | 2,433,050 ▲ +34% |
▲ +34% |
| Maersk Line
Acquired: Hamburg Sud |
3,017,345 | Hamburg Sud2016 Capacity:643,552 | 3,499,976 ▲ +16% |
▲ +16% |
*Figures assume all pending deals are unconditionally cleared by regulators
**Ocean Network Express percent change calculated as the average capacity change for each merging line
SOURCE: Alphaliner TOP 100 data from February 2016, July 2017.
Major carriers benefit from consolidation, gaining market power
At the start of 2016, roughly 20 carriers could claim to control at least 1% of market share. Today, that number has fallen to 16, with six shipping lines rising far above the rest in terms of capacity.
Top 6 ocean carriers' market share
2016
| Company | Market Share |
|---|---|
| Maersk Line | 14.7% |
| MSC | 13.1% |
| CMA CGM | 8.8% |
| Evergreen | 4.6% |
| Hapag-Lloyd | 4.5% |
| COSCO | 4.2% |
 Total Total |
49.9% |
2017
| Company | Market Share |
|---|---|
| Maersk Line | 16.6% |
| MSC | 14.5% |
| COSCO Shipping | 11.6% |
| CMA CGM | 11.5% |
| Hapag-Lloyd | 7.2% |
| Ocean Network Express | 6.7% |
 Total Total |
68.1% ▲ +18.2% |
SOURCE: Alphaliner TOP 100 data from February 2016, July 2017.
Data & Research | Edwin Lopez
Design & Visualizations | Natalie Forman, Jordan Branch


